Worked Examples
In this section we show several worked examples demonstrating how to use iorodeo-potentiostat library with your Rodeostat shield to make measurements.
Note
The examples in this section make use of the Matplotlib [1] plotting library. You can find Instructions for installing maplotlib here: installing Matplotlib [2].
Cyclic voltammetry
In the following example we demonstate how perform a cyclic voltammetry [3] test with the following parameters:
Starts and ends at minimum voltage of -100 mV .
Reaches a maximum voltage of 1000 mV at mid-cycle.
Transistions at a rate of 50 mV/s (-50 mV/s) from the minimum (maximum) to the maximum (minimum) voltage.
Performs a single cycle i.e., transistions from minimum to maximum and back to minimum exactly once.
As the test is run the data are saved to a file named data.txt. The data in the file consist of comma separated values of time, voltage and current. After the test is complete two figures are created to display the data. The first figure shows plots of the voltage (potential) and current vs time. The second figure shows a plot of the current vs the voltage (potential).
from potentiostat import Potentiostat
import matplotlib.pyplot as plt

port = '/dev/ttyACM0'       # Serial port for potentiostat device
datafile = 'data.txt'       # Output file for time, curr, volt data

test_name = 'cyclic'        # The name of the test to run
curr_range = '100uA'        # The name of the current range [-100uA, +100uA]
sample_rate = 100.0         # The number of samples/second to collect

volt_min = -0.1             # The minimum voltage in the waveform (V)
volt_max =  1.0             # The maximum voltage in the waveform (V)
#volt_per_sec = 0.050        # The rate at which to transition from volt_min to volt_max (V/s)
volt_per_sec = 1.00         # The rate at which to transition from volt_min to volt_max (V/s)
num_cycles = 1              # The number of cycle in the waveform

# Convert parameters to amplitude, offset, period, phase shift for triangle waveform
amplitude = (volt_max - volt_min)/2.0            # Waveform peak amplitude (V)
offset = (volt_max + volt_min)/2.0               # Waveform offset (V)
period_ms = int(1000*4*amplitude/volt_per_sec)   # Waveform period in (ms)
shift = 0.0                                      # Waveform phase shift - expressed as [0,1] number
                                                 # 0 = no phase shift, 0.5 = 180 deg phase shift, etc.

# Create dictionary of waveform parameters for cyclic voltammetry test
test_param = {
        'quietValue' : 0.0,
        'quietTime'  : 0,
        'amplitude'  : amplitude,
        'offset'     : offset,
        'period'     : period_ms,
        'numCycles'  : num_cycles,
        'shift'      : shift,
        }

# Create potentiostat object and set current range, sample rate and test parameters
dev = Potentiostat(port)
dev.set_curr_range(curr_range)
dev.set_sample_rate(sample_rate)
dev.set_param(test_name,test_param)

# Run cyclic voltammetry test
#t,volt,curr = dev.run_test(test_name,display='pbar',filename=datafile)
t,volt,curr = dev.run_test(test_name,display='data',filename=datafile)

# plot results using matplotlib
plt.figure(1)
plt.subplot(211)
plt.plot(t,volt)
plt.ylabel('potential (V)')
plt.grid('on')

plt.subplot(212)
plt.plot(t,curr)
plt.ylabel('current (uA)')
plt.xlabel('time (sec)')
plt.grid('on')

plt.figure(2)
plt.plot(volt,curr)
plt.xlabel('potential (V)')
plt.ylabel('current (uA)')
plt.grid('on')

plt.show()
An example of the data generated by running this test using a screen printed electrode in a 8mM solution of ascorbate, is shown below.
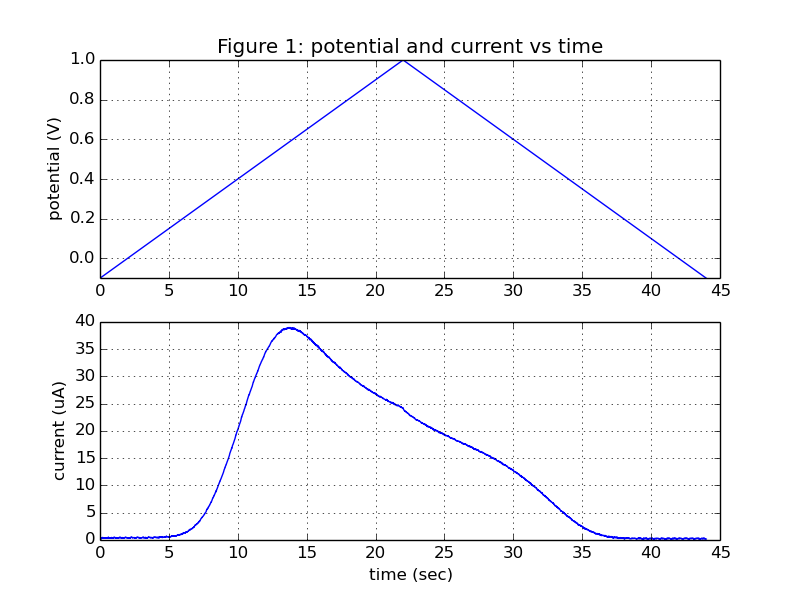
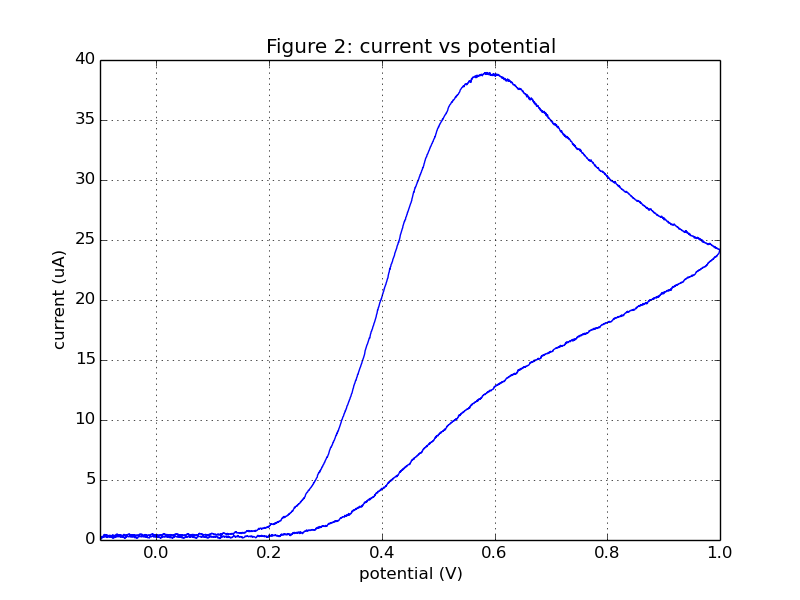
Further details on the methods used for the ascorbate experiments can be found here http://potentiostat.iorodeo.com/methods [4].
Constant voltage voltammetry
This example demonstrates how to preform constant voltage voltammetry. The test parameters are as follows:
Prior to the start of the test a quiet period is used where the output voltage at 0V for 1s (1000ms).
During the test the output voltage is set to 2.5V and kept there for 4s (4000ms).
Data is acquired at a rate of 100 samples/second for the duration of the quiet period and the constant voltage test.
from potentiostat import Potentiostat
import matplotlib.pyplot as plt

port = '/dev/ttyACM0'    # Serial port for potentiostat device
datafile = 'data.txt'    # Name of output data file

test_name = 'constant'   # Name of test to run - constant voltage voltammetery
curr_range = '100uA'     # Name of current range for test [-10uA, +10uA]
sample_rate = 100.0      # Rate (samples/sec) at which to collect samples

test_param = {
        'quietValue' : 0.0,        # Output voltage during quiet peroid
        'quietTime'  : 1000,       # Duration of quiet period (ms)
        'value'      : 2.5,        # Output volatage (V) durring constant voltage test
        'duration'   : 4000,       # Duration of constant voltage test (ms)
        }

# Create Device object and set sample rate, current range and test parameters
dev = Potentiostat(port)
dev.set_sample_rate(sample_rate)
dev.set_curr_range(curr_range)
dev.set_param(test_name,test_param)

# Run cyclic voltammetry test
t,volt,curr = dev.run_test(test_name,display='pbar',filename=datafile)

# plot results using matplotlib
plt.subplot(211)
plt.title('Voltage and current vs time')
plt.plot(t,volt)
plt.ylabel('potential (V)')
plt.ylim(0,test_param['value']*1.1)
plt.grid('on')

plt.subplot(212)
plt.plot(t,curr)
plt.ylabel('current (uA)')
plt.xlabel('time (sec)')
plt.grid('on')

plt.show()
Consider the dummy cell schematic show below. We will use this dummy cell to generate example data using the constant voltage test program (above).
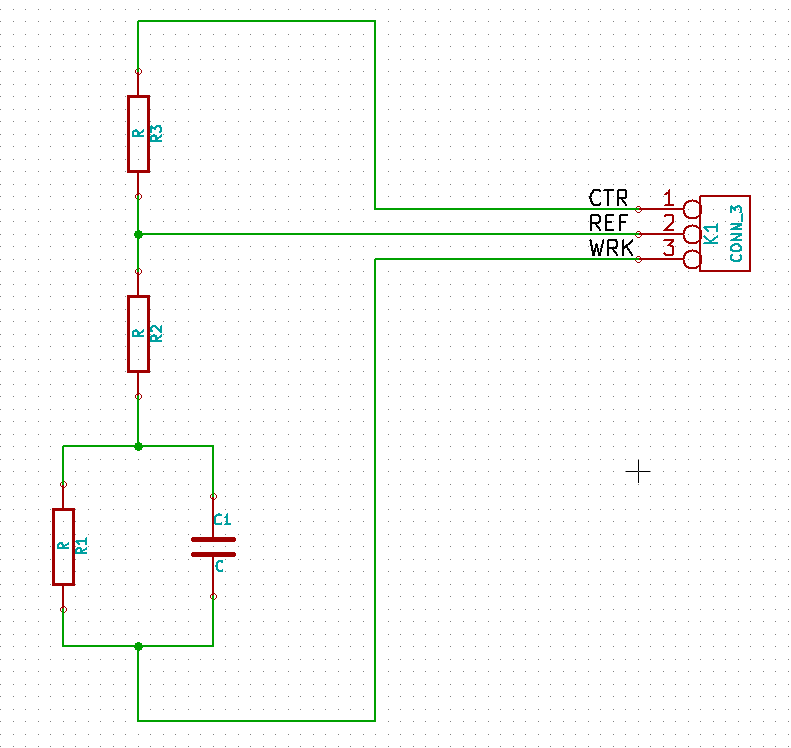
There are three resistors (R1, R2, R3) and one capacitor (C1) on the dummy cell. In the example below, showing voltage and current vs time, the values of the resistors and capacitors are: R1=100k, R2=50k, R3=0 Ohm (wire conductor), C1=4.7 uF.
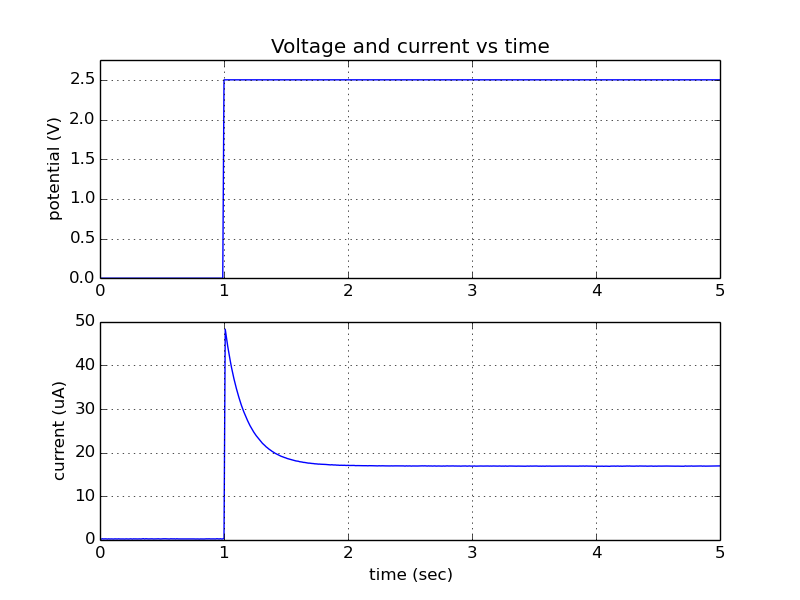
During the one the 1 second quiet period the output voltage is 0 V. After 1 second the actual test begins and the output voltage is set to 2.5 V. There an initial spike in current at the start of the test. The current then decays exponentially, as the capacitor C1 charges, gradually approaching a steady state value.
Manual/direct control:
In this section we give several examples which demostrate how to use the
Rodeostat in manual/direct control mode. When using this mode,
the output voltage is set and the current is measured directly from the host PC
using the set_volt() and
get_curr() methods. Note, the timing in
manual/direct control mode is determined by the software on the host PC and it
will not be as precise as when using a pre-programmed voltammetric test running
in firmware on the Teensy 3.2. However, it does offer a great deal of
flexibility to the user and enables the creation of custom voltammetric test
without any firmware programming.
Example 1: linear plus sinewave
This example demonstrates how to use manual/direct control to create an output voltage which is sum of a linear function and a sine wave.
from __future__ import print_function
from potentiostat import Potentiostat
import time
import sched
import math
import scipy
import matplotlib.pyplot as plt
def run_manual_test(pstat, volt_func, dt, t_stop):
"""
Run a voltammetric test in maunal/direct mode.
pstat = potentiostat
volt_func = output voltage function
dt = sample time step
t_stop = duration of the trial
"""
t = 0
cnt = 0
t_start = time.time()
time_list, volt_list, curr_list = [], [], []
scheduler = sched.scheduler(time.time, time.sleep)
while t < t_stop:
# Set potentiostat output voltage and samle current
volt = volt_func(t)
pstat.set_volt(volt)
curr = pstat.get_curr()
print('{0:1.2f}, {1:1.2f}, {2:1.2f}'.format(t, volt, curr))
time_list.append(t)
volt_list.append(volt)
curr_list.append(curr)
# Run scheduler to until time for the next sample (dt seconds)
t_next = t_start + (cnt+1)*dt
scheduler.enterabs(t_next, 1, lambda:None, ())
scheduler.run()
t = time.time() - t_start
cnt+=1
return time_list, volt_list, curr_list
def create_sin_linear_func(t0, t1, v0, v1, amp, per):
"""
Returns a function which in the interval [t0,t1] is a sum of linear
function and a sine wave.
t0 = time at which linear transition, from v0 to v1, begins
t1 = time at which linear transition, from v0 to v1, ends
v0 = initial value
v1 = final value
amp = amplitude of superimposed sinewave
per = period on superimposed sinewave
"""
def func(t):
if t < t0:
return v0
elif t < t1:
dt_trans = t1-t0
v_lin = (v1-v0)*(t-t0)/dt_trans + v0
v_sin = amp*math.sin(2*math.pi*(t-t1)/per)
return v_lin + v_sin
else:
return v1
return func
if __name__ == '__main__':
# Run parameters
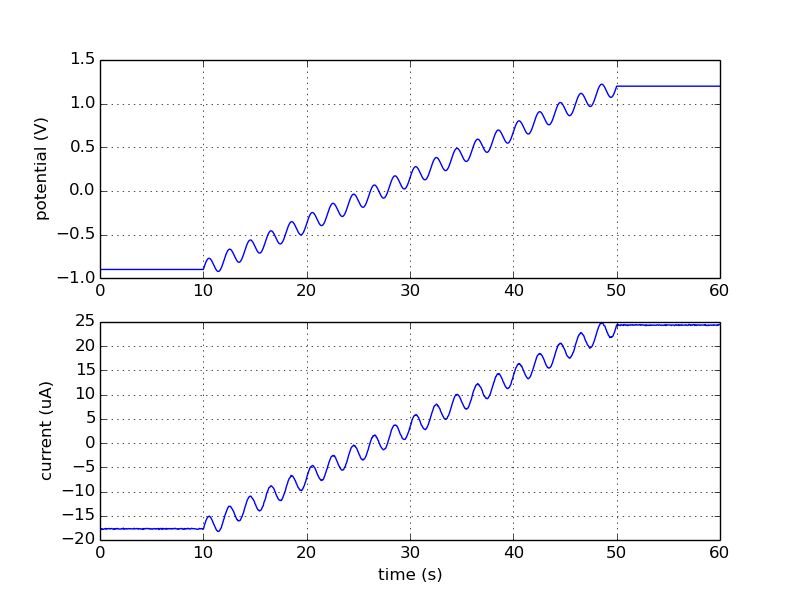
t0 = 10.0 # Transition start time (s)
t1 = 50.0 # Transition stop time (s)
v0 = -0.9 # Initial voltage (V)
v1 = 1.2 # Final voltage (V)
amp = 0.1 # Sinusoid ampliude (V)
per = 2.0 # Sinusoid period (s)
dt = 0.05 # Time step for setting voltage and measurements
t_total = 60.0 # Total experiment duration
volt_func = create_sin_linear_func(t0,t1,v0,v1,amp,per)
# Create device object, set voltage/current ranges and run test
pstat = Potentiostat('/dev/ttyACM0')
pstat.set_volt_range('2V')
pstat.set_curr_range('100uA')
pstat.set_all_elect_connected(True)
t, volt, curr = run_manual_test(pstat, volt_func, dt, t_total)
pstat.set_all_elect_connected(False)
# Plot results
plt.subplot(211)
plt.plot(t,volt)
plt.ylabel('potential (V)')
plt.grid('on')
plt.subplot(212)
plt.plot(t,curr)
plt.xlabel('time (s)')
plt.ylabel('current (uA)')
plt.grid('on')
plt.show()
Example data generated using the program above for 50k dummy cell (R1=50k, R2=R3=0 , C1=0) is shown below.
In a similar manner you can easily create other custom tests by writing your own custom voltage function which gives specifies the desired output voltage as a function of time.
Example 2: long duration constant voltage test
Suppose you want to perform a very long duration (hours to days) constant voltage test with the potentiostat. The sample rate for this test would be fairly low - seconds to minutes between samples. In addition you wanted it such that the logging application for this test could be interrupted and re-started and any time.
In the example below demonstrate how to use manual/direct control to create a such a data logger for long duration constant voltage tests. Once started, the data logger shown below will run forever or until stopped by the user with Ctl-C. The tests can be stopped and re-started and any time. On restart if the data logger finds an existing log file it will open this file and append data to it, otherwise a new log file will be created.
"""
const_volt_logger.py

Example of a constant voltage test data logger which is intended for very long
duration experiments with low sample rates. Uses Python's sched module for
timing. Data is logged to output file specified in the params. The test runs
indefinitely, but can  be interrupted with ctl-c. It can then restarted and
will continue to append data to the same data file.

Potentiostat Shield is operated manual/direct control mode where output voltage
is set directly from python.

"""
from __future__ import print_function
from potentiostat import Potentiostat
import time
import os.path
import signal
import sched

class ConstVoltLogger(object):

    def __init__(self, param):
        """
        param - dictionary of parameters for the constant voltage test. It
        should contain the following items.

         filename      Data log filename
         port          Potentiostat serial port
         volt_range    Output voltage range
         curr_range    Measurement current range
         sample_dt     Sample period (s)
         volt          # Output voltage (V)

        """
        self.param = param
        self.done = False
        self.sep = ','

        self.pstat = Potentiostat(self.param['port'])
        self.pstat.set_volt_range(self.param['volt_range'])
        self.pstat.set_curr_range(self.param['curr_range'])
        self.pstat.set_volt(self.param['volt'])

        self.scheduler = sched.scheduler(time.time, time.sleep)
        self.scheduler_event = None
        signal.signal(signal.SIGINT,self.sigint_handler)


    def get_file_start_time(self):
        t_start_file = None
        if os.path.exists(self.param['filename']):
            line_list = []
            with open(self.param['filename'],'r') as fid:
                try:
                    line_list = fid.readlines()
                    start_line = line_list[0]
                    start_line = start_line.split(self.sep)
                    t_start_file = float(start_line[0])
                except:
                    pass
        return t_start_file


    def run(self):
        self.done = False
        t_start = time.time()
        t_start_file = self.get_file_start_time()
        if t_start_file is None:
            t_start_file = t_start

        print()
        print('press ctl-c to exit')
        print()
        print('t (s), current (A)')
        print('------------------')

        with open(self.param['filename'],'a') as fid:
            cnt = 0
            while not self.done:
                curr = self.pstat.get_curr()
                t_current = time.time()
                t_elapsed = t_current - t_start_file

                fid.write('{0}{1} {2}{3}'.format(t_current,self.sep,curr,os.linesep))
                print('{0:1.2f}{1} {2:1.4f}'.format(t_elapsed,self.sep,curr))

                t_next = t_start + (cnt+1)*self.param['sample_dt']
                self.scheduler_event = self.scheduler.enterabs(t_next, 1, lambda:None, ())
                self.scheduler.run()
                cnt += 1


    def sigint_handler(self,signum,frame):
        self.scheduler.cancel(self.scheduler_event)
        self.done = True

if __name__ == '__main__':

    param = {
            'filename'   : 'logfile.txt',   # Data log filename
            'port'       : '/dev/ttyACM0',  # Potentiostat serial port
            'volt_range' : '1V',            # Output voltage range
            'curr_range' : '1uA',           # Measurement current range
            'sample_dt'  : 5.0,             # Sample period
            'volt'       : 0.5,             # Output voltage
            }

    data_logger = ConstVoltLogger(param)
    data_logger.run()